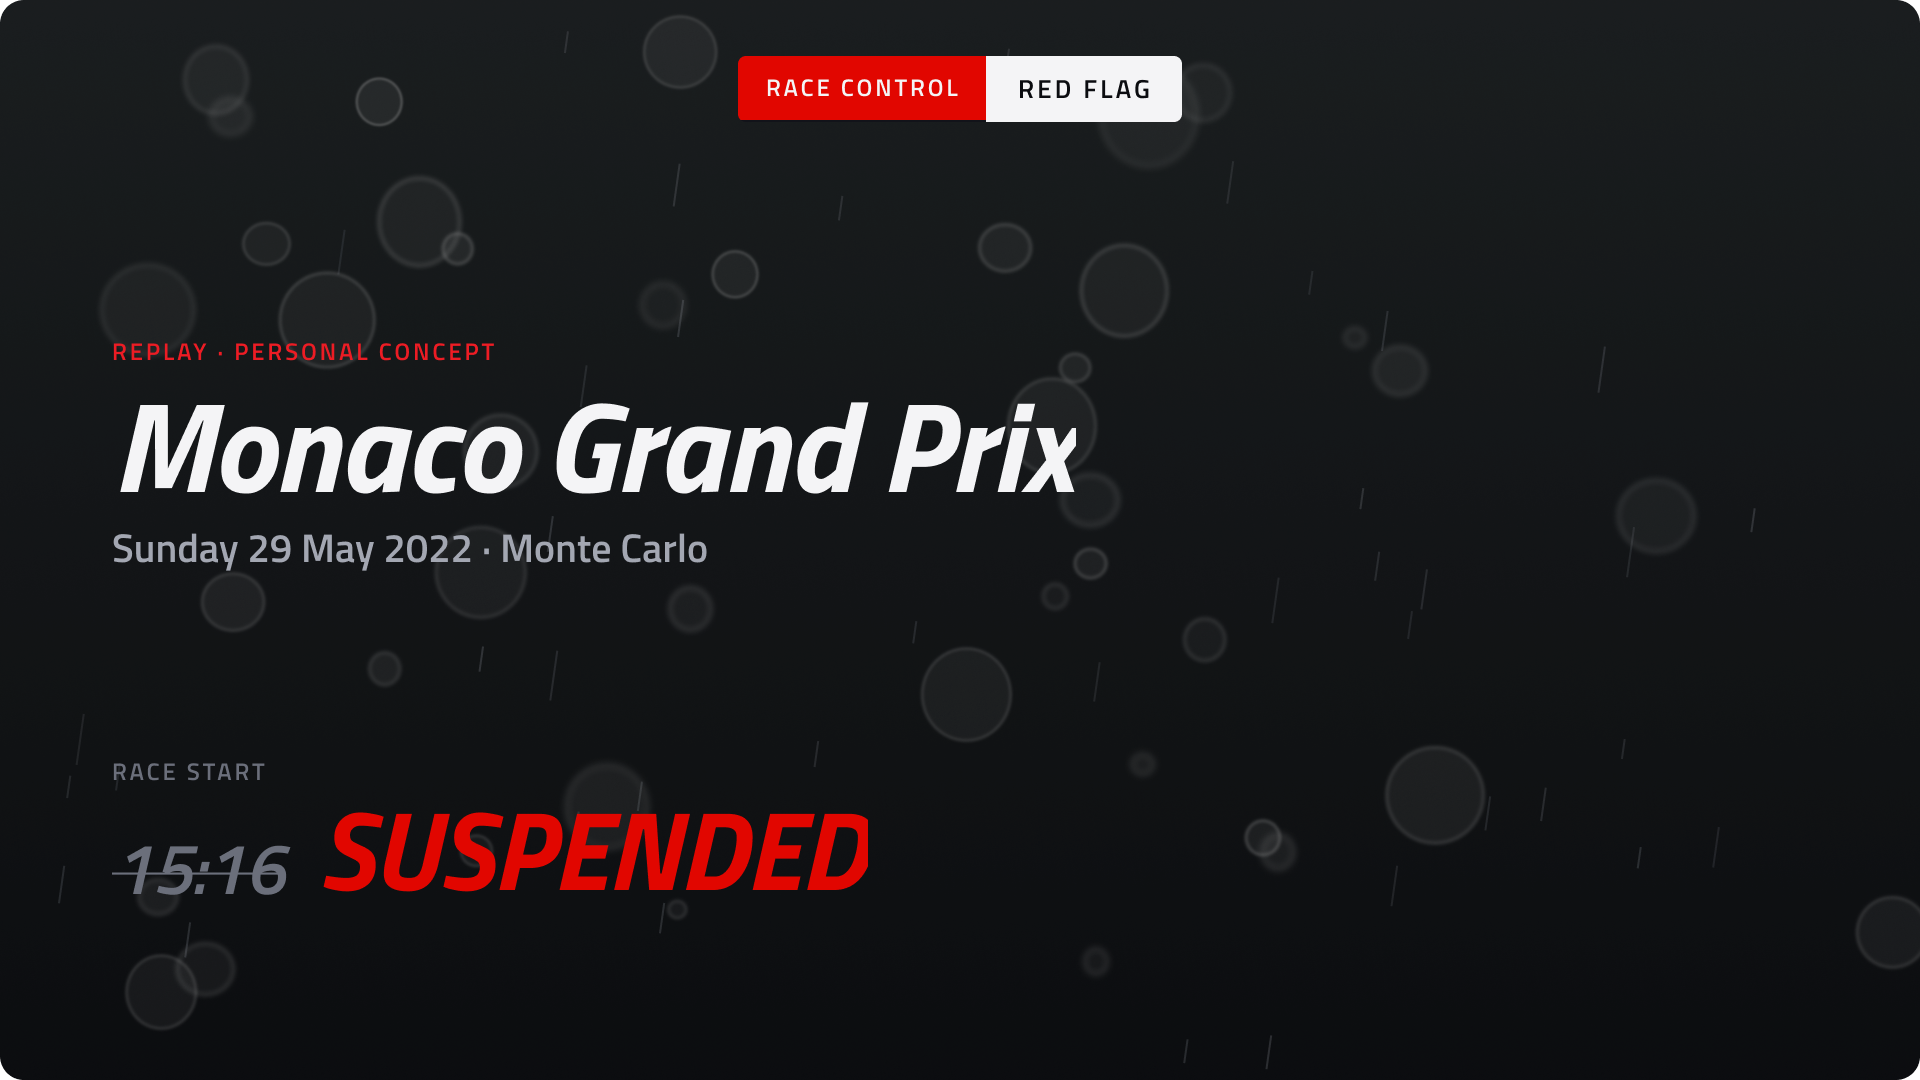
At least one Ferrari made the podium in Monaco in 2022. It could have been two. That sentence is the whole series.
For the next few months I'm rebuilding that race as a story told through interface motion: the timing tower, the pit lane panel, the radio cards, the way F1 TV graphics move. Real data, real lap times, real radio moments. I'm building it on weekends and publishing what I have on race weekends, finished or not. This is episode zero: why this race, and what I found when I opened the data.
Why this race
- The track. Monaco is one of the most historic tracks in F1, and the hairpin is my favourite corner on any of them. It's the slowest corner on the calendar. Watching twenty cars squeeze through it is lovely. Driving it in the rain must be chaos.
- The people. It was Charles's home race, and he started on pole. Carlos is my absolute favourite driver, and he finished second.
- The conditions. It rained. When it rains the field levels out, and the race comes down to driver skill and the right strategy. That's the part I want to dig into.
Whose side I'm on
I couldn't pick between Charles and Carlos, so I picked Ferrari. You watch this race from the Ferrari pit wall, seeing both cars at once. Carlos is in front by default. Nobody needs to know why.
Along the way, a strategist joins the pit wall: Rosso, an AI like Claude. Its job is to find what would have given Ferrari a 1-2 with Carlos winning. It's also allowed to say no. A strategist that only tells you what you want to hear isn't a strategist.
The data lied to me on day one
I pulled the race data with FastF1, a free Python library that reads F1's own timing feed: lap times, tyre stints, pit stops, car positions four times a second, weather, every race control message. Then I started checking it.
The weather data says it rained until the end. It didn't. Everyone was on slick tyres from lap 22. So the drying track in my version comes from track temperature, lap times and tyre changes instead of the rain flag.
The tyre data disagreed with Pirelli. FastF1 showed both Ferraris changing tyres at the red flag. Pirelli's official chart showed no change at all. I went back to the raw timing feed: "tyres not changed", nine laps already on the set. Pirelli was right. FastF1 only opened a new stint because the cars drove through the pit lane during the stoppage.
At the restart, Carlos was on hard tyres with nine laps on them. Pérez, the car he lost to by 1.154 seconds, had just switched to mediums.
Red Bull changed under the red flag. Ferrari didn't. That was a decision, not bad luck.
- Carlos gambled on staying out on full wets while Charles switched to intermediates, and on lap 19 Carlos led the Monaco Grand Prix.
- On lap 21 Ferrari brought both cars in on the same lap. Charles spent 28.0 seconds in the pit lane to Carlos's 24.6. About 3.4 seconds of that was waiting behind his teammate.
- Pérez's stop a lap later took 24.6 seconds too. Red Bull didn't win in the pit lane. They won on track: one more fast lap on intermediates while Carlos was on his out-lap on cold tyres, stuck behind a lapped Latifi.
What the broadcast didn't connect
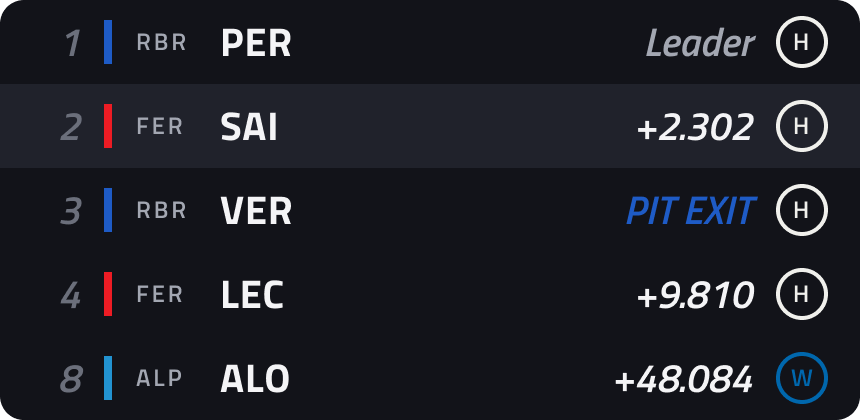
I rewatched the highlights and screenshotted the graphics. Six frames from laps 18 to 23 tell exactly how Ferrari lost the lead: Charles pits, Carlos leads, Carlos is in the box while Charles is on the radio, Pérez leads, then Red Bull 1-2 and Ferrari 3-4.
Every piece is on screen. Nothing connects them. Nothing says "Charles is about to queue behind Carlos" or "Red Bull is pitting a lap later to jump you." That gap is what I'm designing for: the same broadcast language, but showing cause and effect.
What I set up this week
- The data, exported for all 20 cars, with my corrections written into the export script so they're never lost.
- A visual language: near-black surfaces, Pirelli's tyre colours, F1's timing colours, Titillium Web, and Ferrari red as the only accent. Every team gets its colour plus a three-letter tag, because four teams were blue in 2022 and colour alone isn't enough.
- A storyboard and a first prototype of the opening, which you'll see tomorrow.